
The Blank Screen Problem
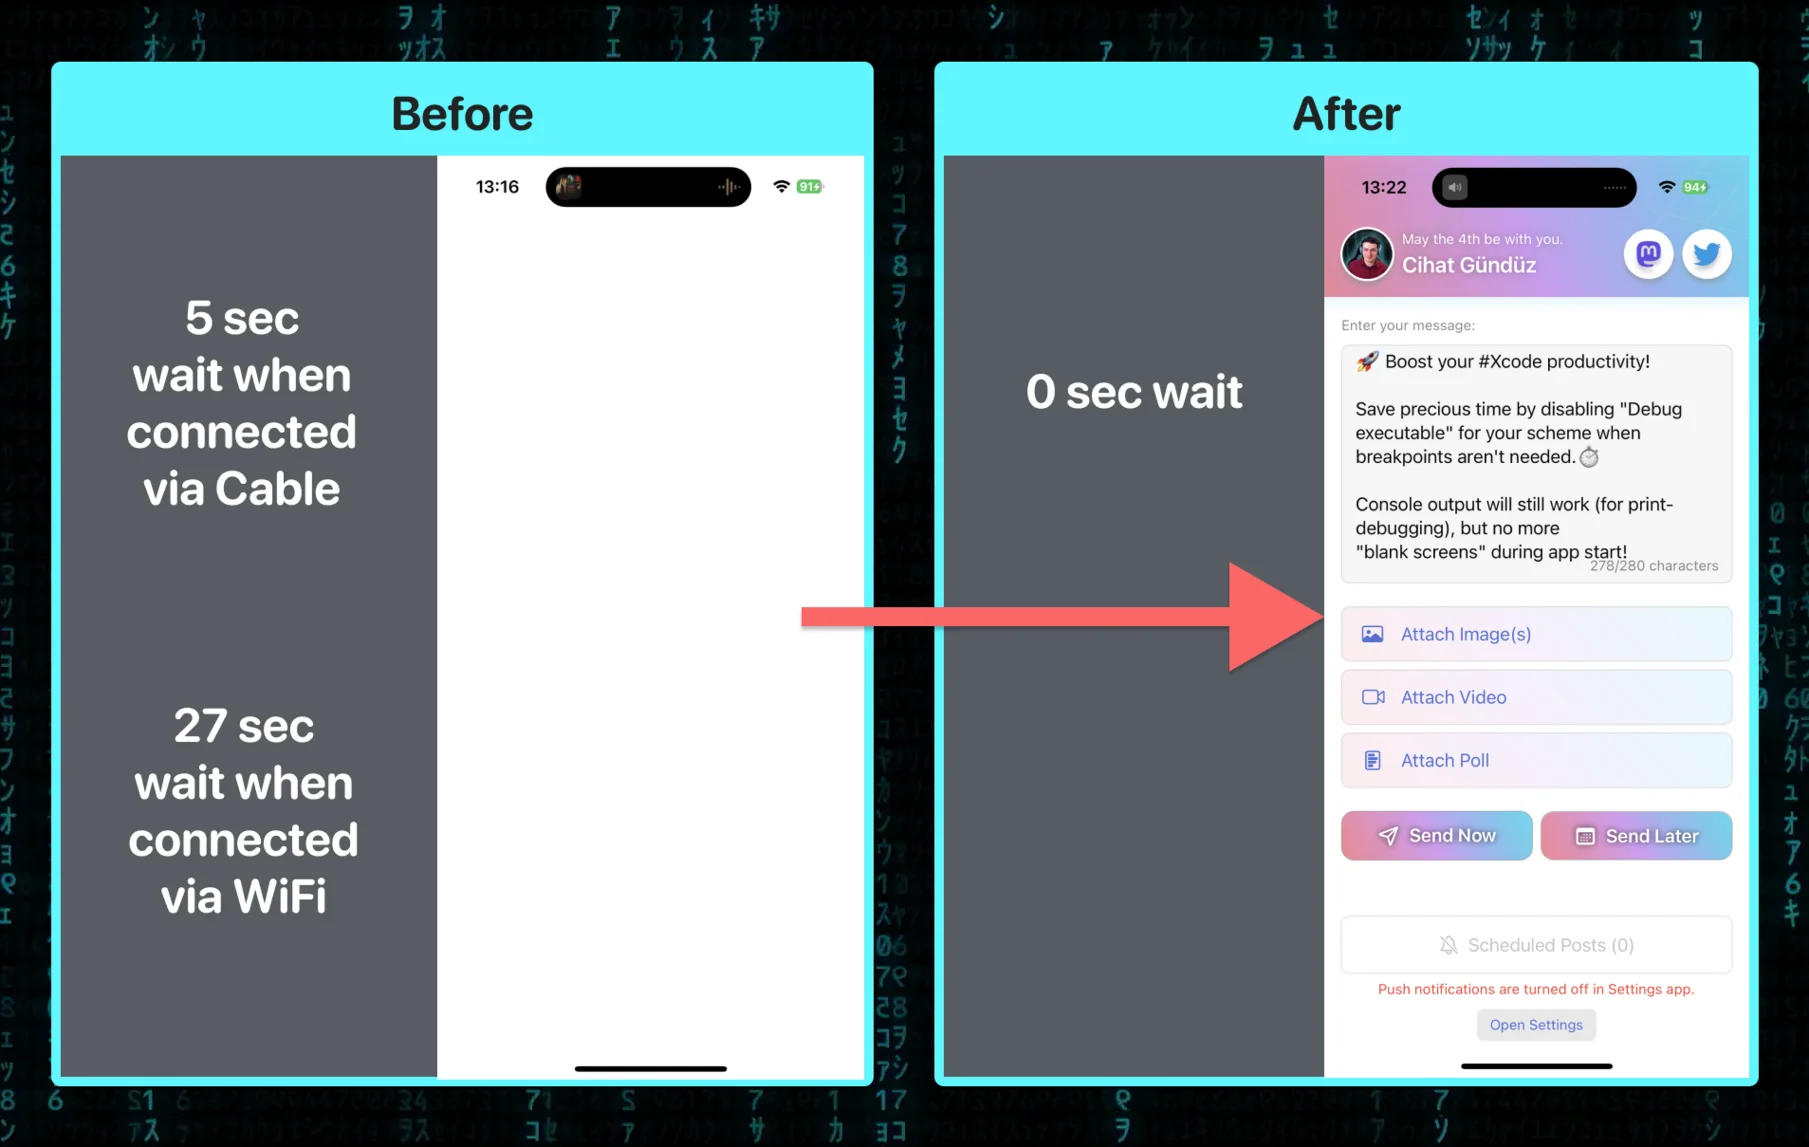
If you have ever noticed a delay – sometimes several seconds – between pressing Run in Xcode and your app actually appearing, the culprit is often the LLDB debugger attaching to your process. During this time, the Simulator shows a blank screen while the debugger initializes.
Where to Find the Setting
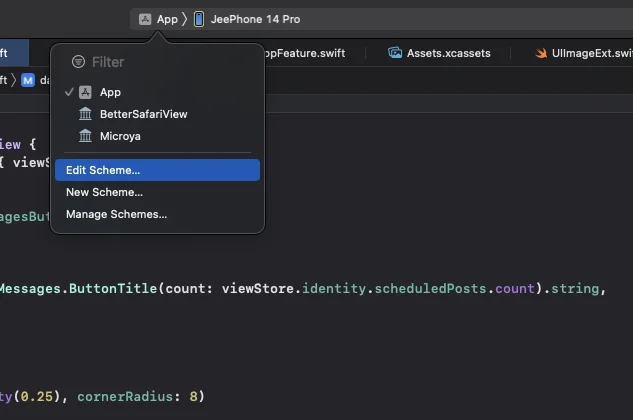
The setting lives in your scheme configuration:
Go to Product > Scheme > Edit Scheme (or press Cmd+Shift+<)
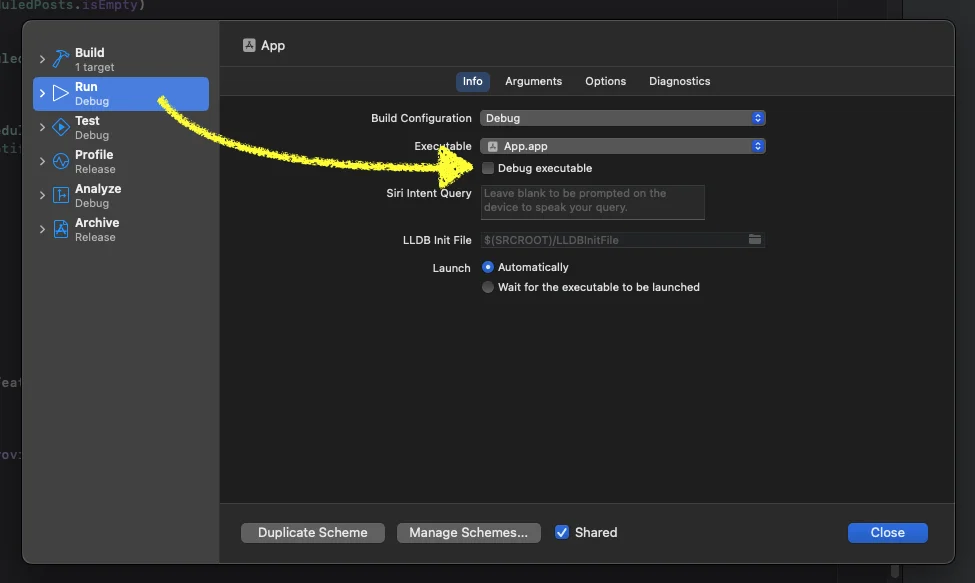
Select the Run action on the left
Switch to the Info tab
Uncheck Debug executable
What This Does
When “Debug executable” is enabled (the default), Xcode attaches the LLDB debugger to your app process at launch. This is what enables breakpoints, the debug memory graph, view hierarchy debugger, and po commands in the console.
Disabling it skips the debugger attachment entirely. Your app launches noticeably faster – in my experience, the difference can be 2 to 5 seconds on larger projects. Console output via print() and os_log still works normally, so you can still use logging for debugging.
The Trade-Off
Without the debugger attached, you lose:
Breakpoints (they will not trigger)
poandexpressioncommands in the consoleMemory graph and view hierarchy debugging tools
This makes the setting ideal for UI iteration work, where you are making visual tweaks and re-running frequently. When you need to investigate a specific bug with breakpoints, just re-enable the checkbox temporarily. I keep it off most of the time and only toggle it on when I need to step through code.